
Is AI-based Root Cause Analysis a Real Thing?
Logs, LLMs, AI, Decision Trees, and Root Causes


Intro
Hello friends. I hope you all had a good winter.
I moderated a panel for LeadDev in October titled “An Engineer’s Guide to Making Sense of Log Data.” You can check out the video here:
During the planning meeting before the panel, I asked: “Do you think we should be talking about AI at all?” as we had plenty of other topics. Opinions were mixed.
But the most decisive response was: “It’s 2024. We definitely should be talking about AI.”
It was a good point in 2024, and an even better one in 2025. So, for this post, I’m going to do a brief, high-level exploration into what it could mean to “run AI on your logs.”
Minimizing Production Incidents
If I ask myself, “How can we best leverage our logs?” and sort descending by impact, the first place I land is on limiting the impact of production incidents.
Broadly, here is a non-exhaustive list of techniques that come to mind for limiting incident impact:
Mitigation
Building failover capabilities to route traffic from malfunctioning clusters to good ones, typically across regions.
Graceful Degradation
Minimizing overload by load shedding and rate limiting.
Serving fallbacks to enable viable customer experiences during error conditions.
Realistic Testing
Using shadow traffic to test new builds with real traffic.
Gradual Rollout
Running canaries to expose new builds directly to real traffic.
Slowly increasing traffic to new builds over a few hours, instead of all at once.
Aggressive Detection
Using anomaly detection to proactively detect deviations in system behavior before they spill over into customer impact.
I’ll stop here, because… none of this is related to AI or logs at all.
Many commercial operational tools sell their ability to decrease MTTR, and that’s great if it’s true, but I’ve always felt that limiting blast radius was far more powerful.
So my first point has two parts:
Limiting the blast radius of incidents is far more important than decreasing MTTR.
Using AI doesn’t help limit the blast radius of errors unless you’re explicitly asking it how to design your systems to accomplish this.
To paraphrase: There’s no point using AI on your logs if you can’t even do gradual rollouts.
Relevant talk about limiting the blast radius of config changes at Meta:
Pour One Out For the AI Doomers
It would have been clever to end the post after the first point, effectively saying: The most impactful way to use logs and AI to improve your operations is to forget about logs and AI and work on limiting the blast radius of your changes.
I see a lot of posts that are similar to this in spirit, saying things like:
All AI generated code sucks. (Narrator: It doesn’t.)
AI is all hype. (Narrator: Clearly, it’s not.)
Don’t worry, all of our jobs are safe. (Narrator: They’re not.)
And so on. I’ll have posts on each of these items in the near future. But I’m not an AI Doomer, and I don’t want to be clever. I want to travel into the heart of the matter, even if it requires me to admit that I don’t know anything. Let’s proceed.

Finding “Root Cause(s)”
If you can limit the blast radius of incidents, that’s great.
If you can mitigate them by doing a quick rollback or failover, that’s great also.
But at some point, you have to find and fix the issue(s), so let’s first discuss how we do that in the absence of AI, and then how AI could help.
A Decision Tree for System Errors
Here’s a diagram I created as an attempt to capture the logic of investigating a production software system that is having problems. It’s a part of the upcoming Chapter 3 of my book PUSH TO PROD OR DIE TRYING which I plan to release in May.
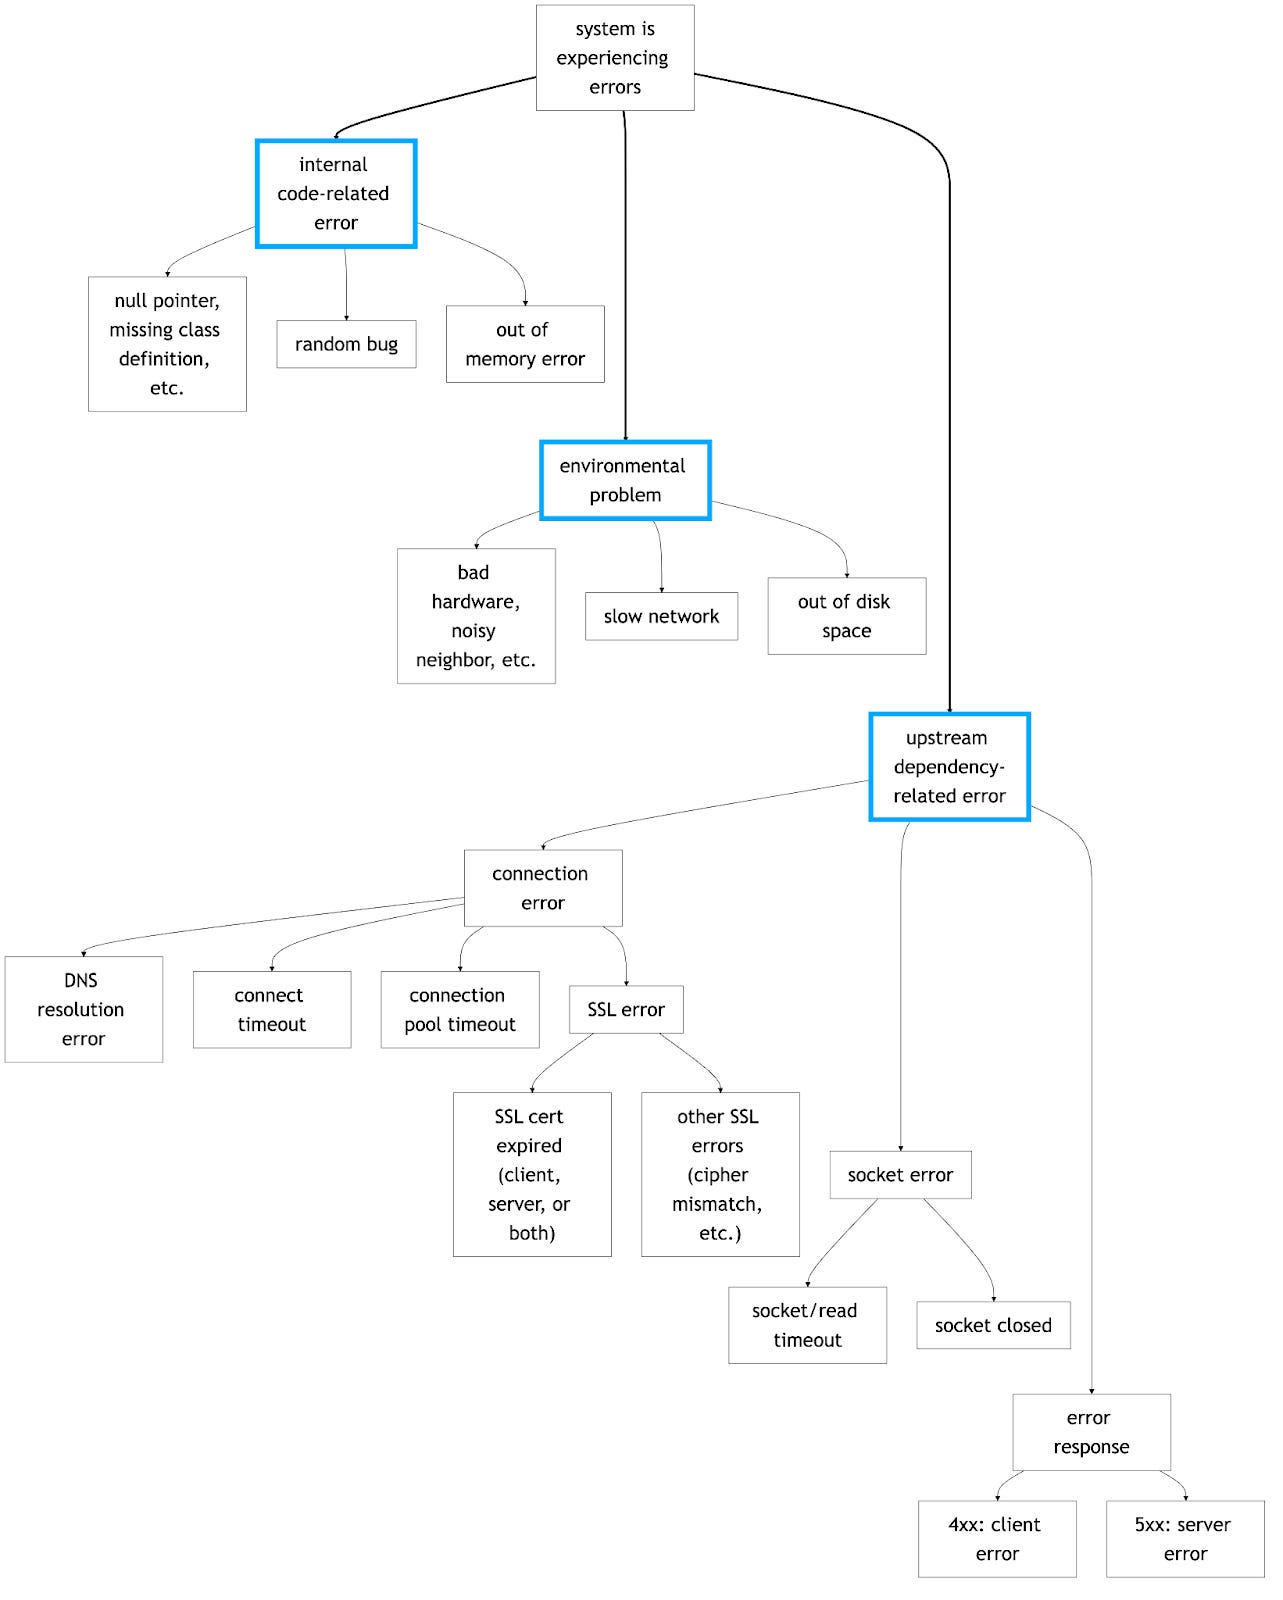
It’s an imperfect, simplified representation of a complex reality, but good enough for today.
A few notes:
There are three high-level problem categories: code errors, environmental errors, and dependency errors.
These categories are not discrete, and problems often drift across them as part of the causal chain. For example, an environmental error may expose a previously unencountered software bug.
If a dependency error is not connectivity-related and manifests as the system in question receiving HTTP 5xx responses from an upstream service, we’d then continue the same investigation on the upstream service.
Following on, a full incident investigation may result in multiple instances of this diagram, each experiencing an error from a different part of the tree.
This diagram does not document error mitigation or resolution at all. That would be an entirely different tree, likely informed by the results of this one.
Now, is it possible to ingest logs into an AI system of some sort that can tell me:
The first system in the dependency chain to experience unexpected errors?
An analysis of the errors, ideally proceeding in a “5 Whys” fashion towards something akin to either a root cause or contributing factors, depending on your preferred interpretation of reality?
Locating Errors
For the first question above, if we could find a way to ingest the system dependency chain through some type of distributed tracing, then that’s a solid start.
Combine that with looking at the timestamps of the errors, and you could generate a theory about at least one source of the errors with a 50+% probability of correctness, by my estimate.
If the theory is wrong, that sucks, but the information gathered to derive the theory could be used by humans to form other theories, and you’re already off to a much better start than you would be if you were doing this the old-fashioned way.
Explaining Errors
Explaining the what and why of the situation looks to be much harder.
Let’s use a hypothetical but specific example:
Imagine there is a TokenService that sits at or very close to the root of your dependency tree. It is used to decrypt authentication tokens.
You run a search-heavy product, and see a spike in connection errors between SearchService and TokenService as your product moves into peak hours on a Friday.
If you’ve ever been responsible for the stability of a product involving multiple systems, you’ll understand that “SearchService can’t connect to TokenService” is more likely a symptom than a cause.
But, it’s a great start to a conversation involving questions such as these:
Is connectivity totally broken between the two services? In other words, can any SearchService nodes connect to any TokenService nodes?
If not totally broken, is it broken in an unevenly distributed way across the affected nodes, such as all of the errors being in a single data center and/or availability zone?
Did the problem start immediately after a deployment of either service?
Depending on the answers to these and a few other questions, we may end up with one or more of these as contributing factors:
SearchService was deployed with a connection timeout that was too low for TokenService, causing all connection attempts to fail.
SearchService failed to scale up properly going into peak hours, causing a spike in CPU usage, which resulted in increased connection errors to all upstream services.
TokenService is the earliest dependency in SearchService’s call chain, so those errors were most notably elevated.
SearchService’s client SSL cert for authenticating to TokenService expired.
There was a service registry error causing a subset of SearchService nodes to attempt to connect to incorrect TokenService nodes.
You get the idea. I’ll refrain from diving deeper as I have a bunch of upcoming posts about operational debugging.
My point is: Going from an error message to one or more possible causes is complex, and triangulating on a precise cause often requires inspecting many other external systems for things such as deployments, autoscaling events, and so on.
How Is This Intelligence Acquired, Maintained, and Actualized?
Let’s assume the primary contributing factor from the SearchService/TokenService example was item 2: SearchService failed to scale up, CPU usage spiked, and connection errors spiked.
First, let me say this:
I am uncertain of how to build a Root Cause Analyzer that can generate this result by parsing errors from a log file.
I am skeptical of anyone saying that they have built this successfully.
But, I also believe that:
Systems to do this will be built within the next few years.
Systems to partially do this may exist now.
Pursuing an AI-based Root Cause Analyzer is worthwhile, as many of the requisite sub-components would be immediately useful, even if the end-to-end system is not.
For this example, imagine a system that:
Alerted on elevated errors
Correlated the error spike with:
A CPU spike in the same cluster
A severe decrease in upstream traffic to all other dependencies
Noticed that the cluster’s instance count was significantly lower than usual at this day and time
Found errors in the autoscaling logs to confirm that the cluster failed to scale up as desired
Identified the autoscaling issue as a primary contributing factor
We just described what the system does. But, how is it built?
Could we avoid building it at all by purchasing a license for Datadog or a similar competitor?
I have near-zero experience with the product. Among many other things, it appears to sell itself as an out-of-the-box root cause detector. I want to believe, but I don’t. I’m eager to be proven wrong.
Is it a decision-tree-style model, such as a Random Forest or Gradient Boosted Tree?
I have no experience with this other than some brief reading, but I could imagine training on normalized log embeddings as features, and using a set of known incident types as labels.
That sounds simple enough, but gathering and maintaining this training data seems cumbersome, and I’m unsure how to represent the time dimension.
By “time dimension”, I mean that the order of errors often dictates the cause, so you can’t always derive a complete answer from using text embeddings to match error text to likely causes.
Is it an LLM equipped with tools to inspect the current state of the execution environment?
I believe this is one way to define an “AI Agent”. But I still don’t fully grasp how an LLM becomes aware of tools and decides how, why, and when to use them.
I’m also unsure how to handle training the LLM with language-based knowledge specific to a single company. You probably don’t want to retrain the full LLM every day, so are you fine-tuning it at some cadence with your specific logs and errors?
Is it one of the new LLM reasoning models?
I don’t know enough about them to comment, but I skimmed this post and found it interesting.

If you enjoyed this post, check out my early-release book PUSH TO PROD OR DIE TRYING.
It’s filled with stories and lessons about building technology to detect, resolve and survive life-altering operational incidents.
Outro
This post is 99% questions and 1% answers, and 1% is generous. But, it is an accurate representation of my current understanding.
Operational work is repetitive, but every incident is slightly different. It’s hard, but detecting and fixing similar incidents gets easier if you focus on improvements. There is a wide open space for technology to improve every aspect of this experience, but I can’t imagine any effective near-term scenario without humans in the loop.
While I’d enjoy the ability to routinely push a “find root cause” button, I don’t believe we’re there yet.
Until then, we remain those humans in the loop. Thanks for reading.