
Queueing Requests Queues Your Capacity Problems, Too
On queues, capacity, and why your dashboard is lying to you


Here’s an exchange I had on twitter a few months ago:

My intent here is not to single this gentleman out, as from what I can tell, he runs a very successful business and is likely smarter than me in many ways. That said, he and I have a different understanding of queueing, a topic dear to my heart that I’ve written about before:
Allow me to paint you a picture: your p90 latency graph looks perfectly healthy at or around 1 second, while every customer request submitted in the last hour is experiencing latency of 1 hour because they are waiting behind 3.6 million other requests in the queue.
How could this happen?
A Few Numbers
Let’s say you’re providing an API, and real-world constraints lead you to believe that offering a queue-like interface would be a good alternative to your existing real-time request/response model.
Some more specifics:
Your request rate is a flat 1000 requests/second for 24 hours per day, 7 days per week.
Every request takes 1 second to process.
You are running 10 nodes, each of which can comfortably handle 100 requests/second, giving you a total capacity of 1000 requests/second across your cluster. You are perfectly at capacity — the incoming request rate you’re seeing exactly matches the request rate you can handle. At a higher request rate, your CPU gets spiky, and 90th percentile latency notably increases.
Then, you start to see traffic multiply during certain hours. For our example, the request rate doubles to 2000 requests/second from 8pm-9pm, every day.
You have a few options:
Reject any requests beyond your capacity.
Add nodes to your cluster, which, assuming you load balance effectively, increases your capacity but also increases your costs.
Add a queue as a mechanism to delay requests while preventing your system from becoming overloaded.
Rejecting requests sounds harsh, and adding capacity sounds expensive, so queueing is a very seductive choice. But it’s also a costly one, as we’ll discuss next.
Perceived Latency and Queue Sizes
Let’s examine how our hour-long 2x request spike affects latency:

From 8pm to 9pm latency increases from 1 second to 1 hour.
Let me clarify very loudly that this is perceived latency, sometimes known as client latency, not server latency. The primary difference is that perceived latency includes queueing time, whereas server latency typically does not.
Why is latency so high? It’s queueing delay, because our queue is growing:

A few things:
You’re running at a 2x capacity deficit. For every second between 8pm and 9pm, you process 1000 items and queue 1000 more. So at the end of that hour, you’ve queued 3.6 million items. (1000 excess requests/second * 3600 seconds)
Once the request rate drops back to our max capacity at 9pm, we are no longer increasing the queue size. But we’re not decreasing it either, because we have no spare capacity to process it.
If we process queued items in a FIFO manner, at 9pm, a new item has 1 hour’s worth of items in front of it. So it waits in line for 1 hour to be processed for 1 second. This explains the latency increase.
Let’s contrast this with the queue size and perceived latency if our request spike from 8pm to 9pm was only 10% beyond our capacity - 1100 requests/second instead of 2000:


Even with just a 10% capacity deficit for one hour, you’re looking at 360k queued requests and 6 minutes of queueing delay if pulling from the queue in a FIFO manner.
Queuing and Surrealism
Most production request spikes I’ve seen are smaller than 2x and shorter than 1 hour, but they are also entangled with things like:
Retries: generally a bad mix with queueing, as a client can send a request that gets queued, then timeout and send a retry that also gets queued.
Autoscaling: generally a good mix with queueing, as long the the capacity deficit is in the scaled up system and not an upstream dependency. If it’s the latter, your system effectively acts as a queue in front of the upstream system, which often contributes to thundering herds.
(deep inhale) New nodes spawned from autoscaling immediately becoming overloaded and dying, yet still being reported as alive because the pod is up but the application isn’t, or maybe other things, but we don’t understand how Google Kubernetes Engine autoscaling works in deep enough detail and are not willing or able to allocate more time to it this sprint.
The numbers here are simplified on purpose, as the real-world situations where these concepts apply are often very intense and confusing. Understanding the clean version of the problem helps me to reason through the messy one.
Alternative Approaches to Queue Processing
To reiterate, with a FIFO queue and the 1100 request/second peak example, all latency aggregates (p50, p90, etc.) take 6 minutes (technically 6 minutes plus 1 second) from 9pm onward:

What if, instead of FIFO, we randomly selected items from the queue instead? I ran a simulation:

A few things:
Our median drops a small amount, from 6 seconds to 5 seconds
Our p25 drops from 6 seconds to roughly 2 seconds
Our p90 gets much worse, from 6 seconds to roughly 14 seconds
FIFO is tough but fair — first in, first out. Nobody jumps in line.
When we start experimenting with alternative approaches, we are making one subset of requests much slower while making another subset much faster. This sounds cruel, but isn’t it just as cruel to make every request take 6 minutes?
Rejecting requests is the extreme edge of this, where we explicitly reject one subset of requests in order to service the other subset with minimal degradation.
Maybe randomly selecting from the queue is too unfair. I simulated weighted quartile queue selection, which selects from each queue time quartile with weighted probabilities, selecting from:
The oldest 25% items 40% of the time
The next oldest 25% 30% of the time
The next oldest 25% 20% of the time
The next oldest 25% (aka… the youngest) 10% of the time

Median increases a bit, p90 and p99 decrease a bit. Definitely more fair.
Me: What if we did an even 25% selection from each quartile?
Claude: That’s exactly what a uniform random distribution would do.
Me: (long, blank stare) Yes, that makes sense.
Percentiles are cool and all, but I pondered this concept for awhile:
If I sent a request into this system at 9pm, what is the probability that my latency would be 1 minute vs. 10 minutes?
I generated graphs for latency confidence intervals, which is the closest thing I could think of to represent this, other than doing a pure simulation and graphing a dot for each latency number. These graphs somewhat restate the obvious, but I think they’re cool:
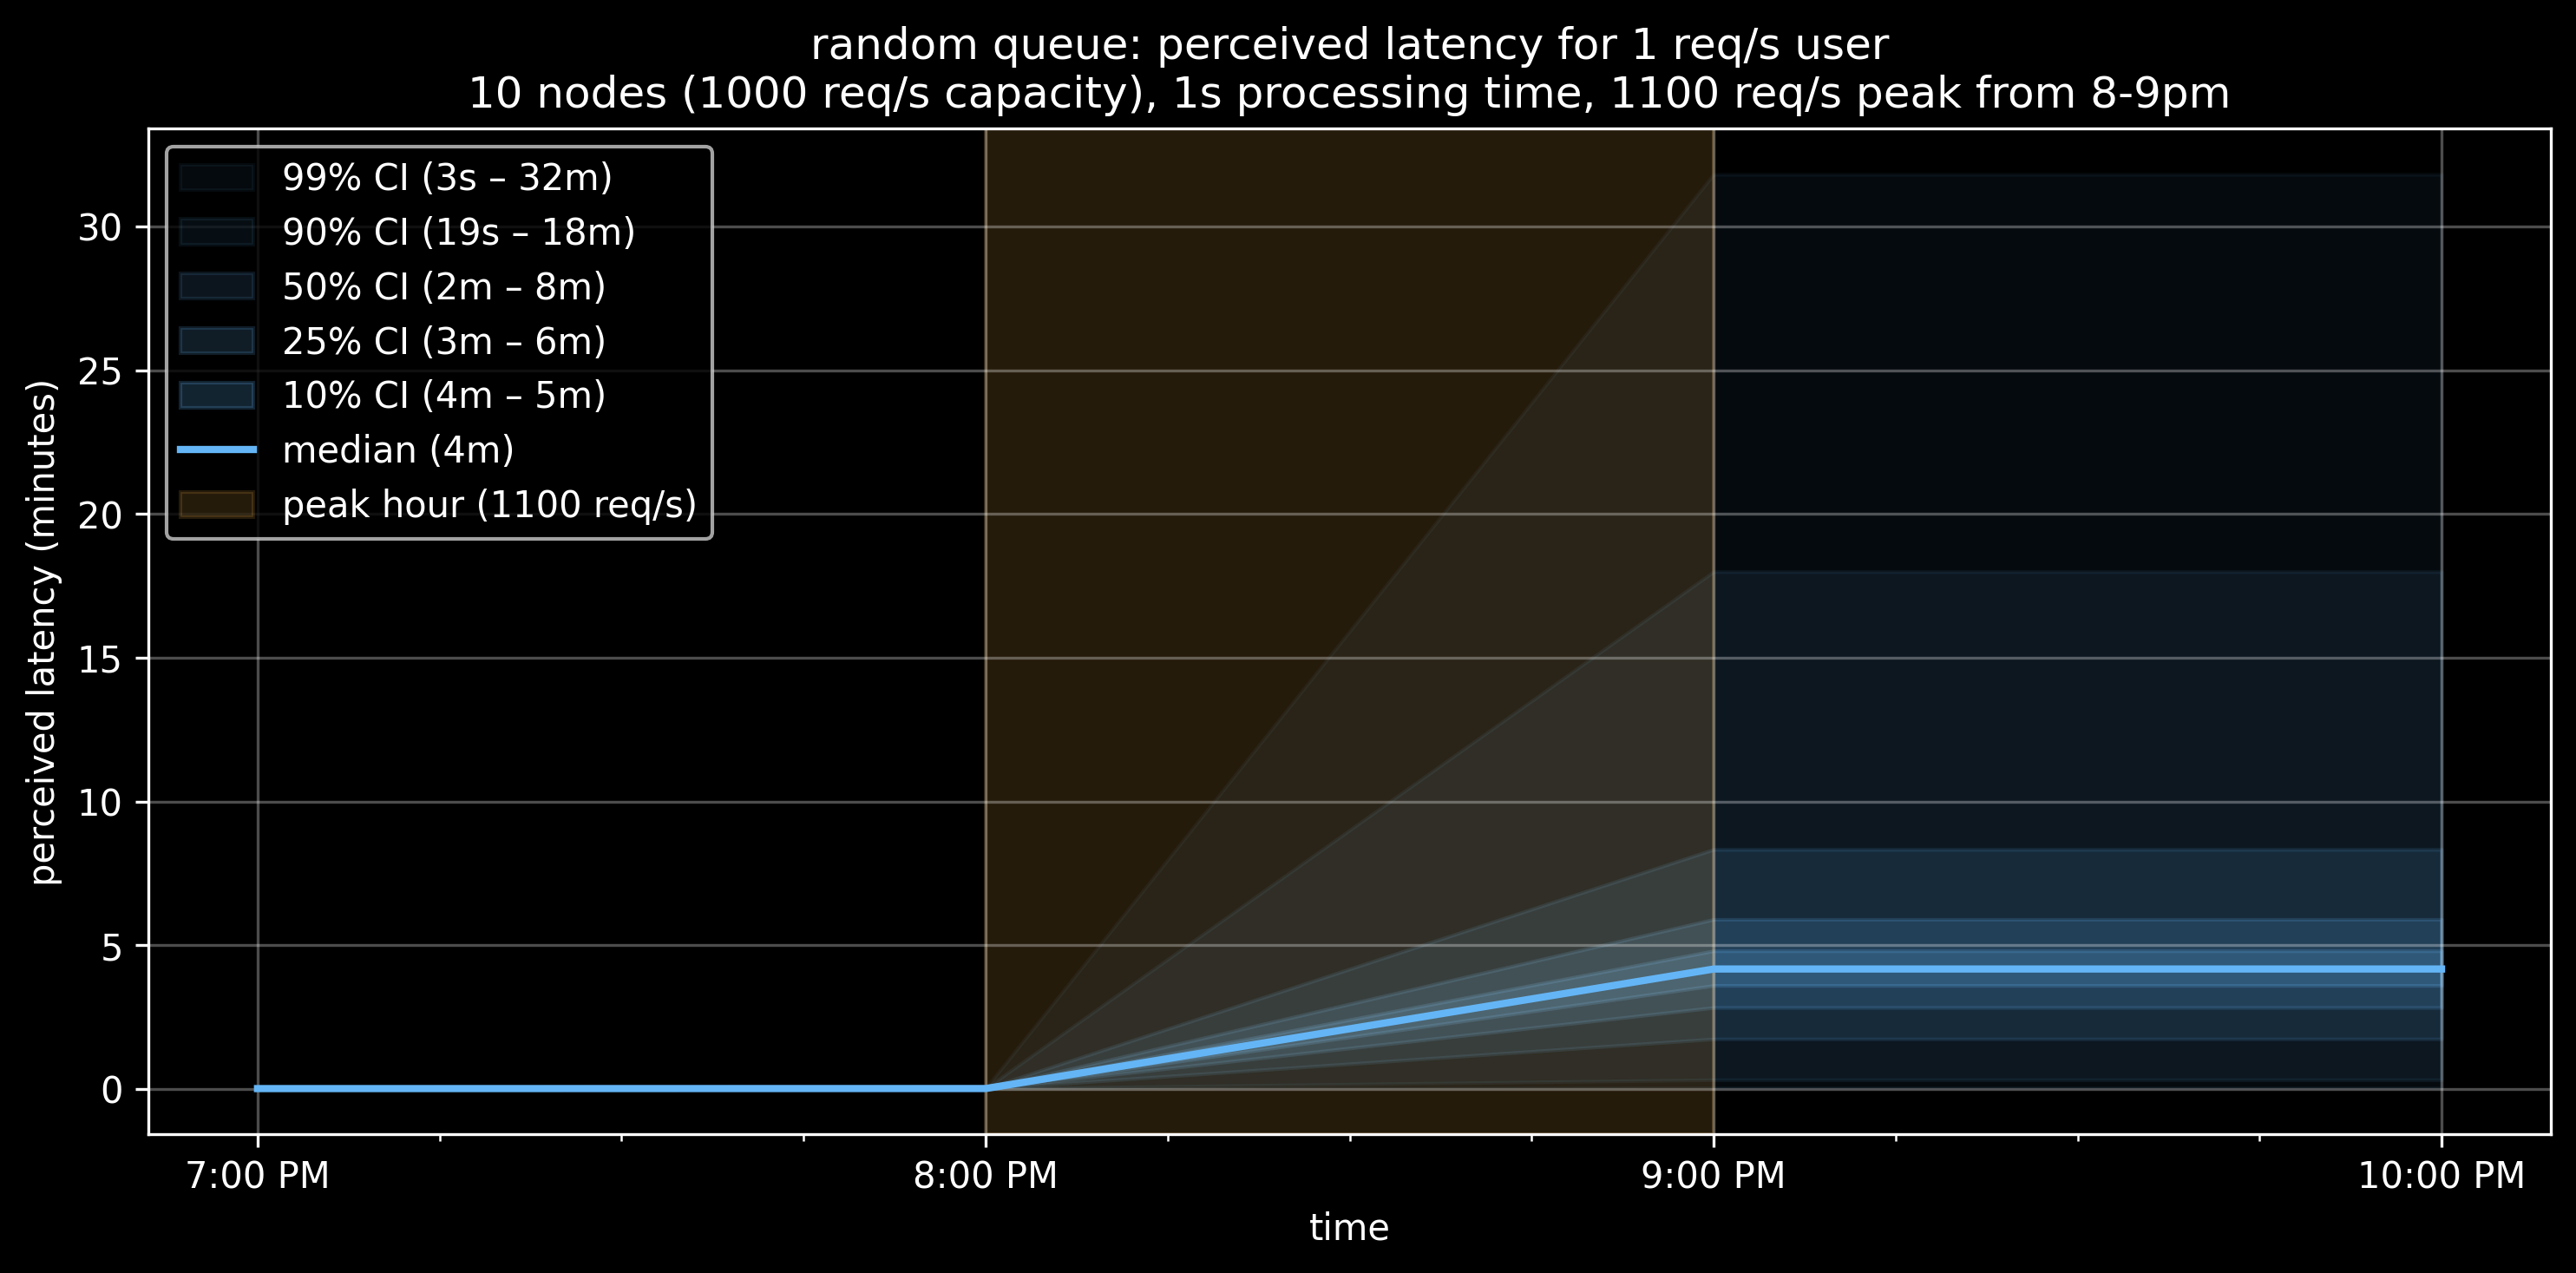
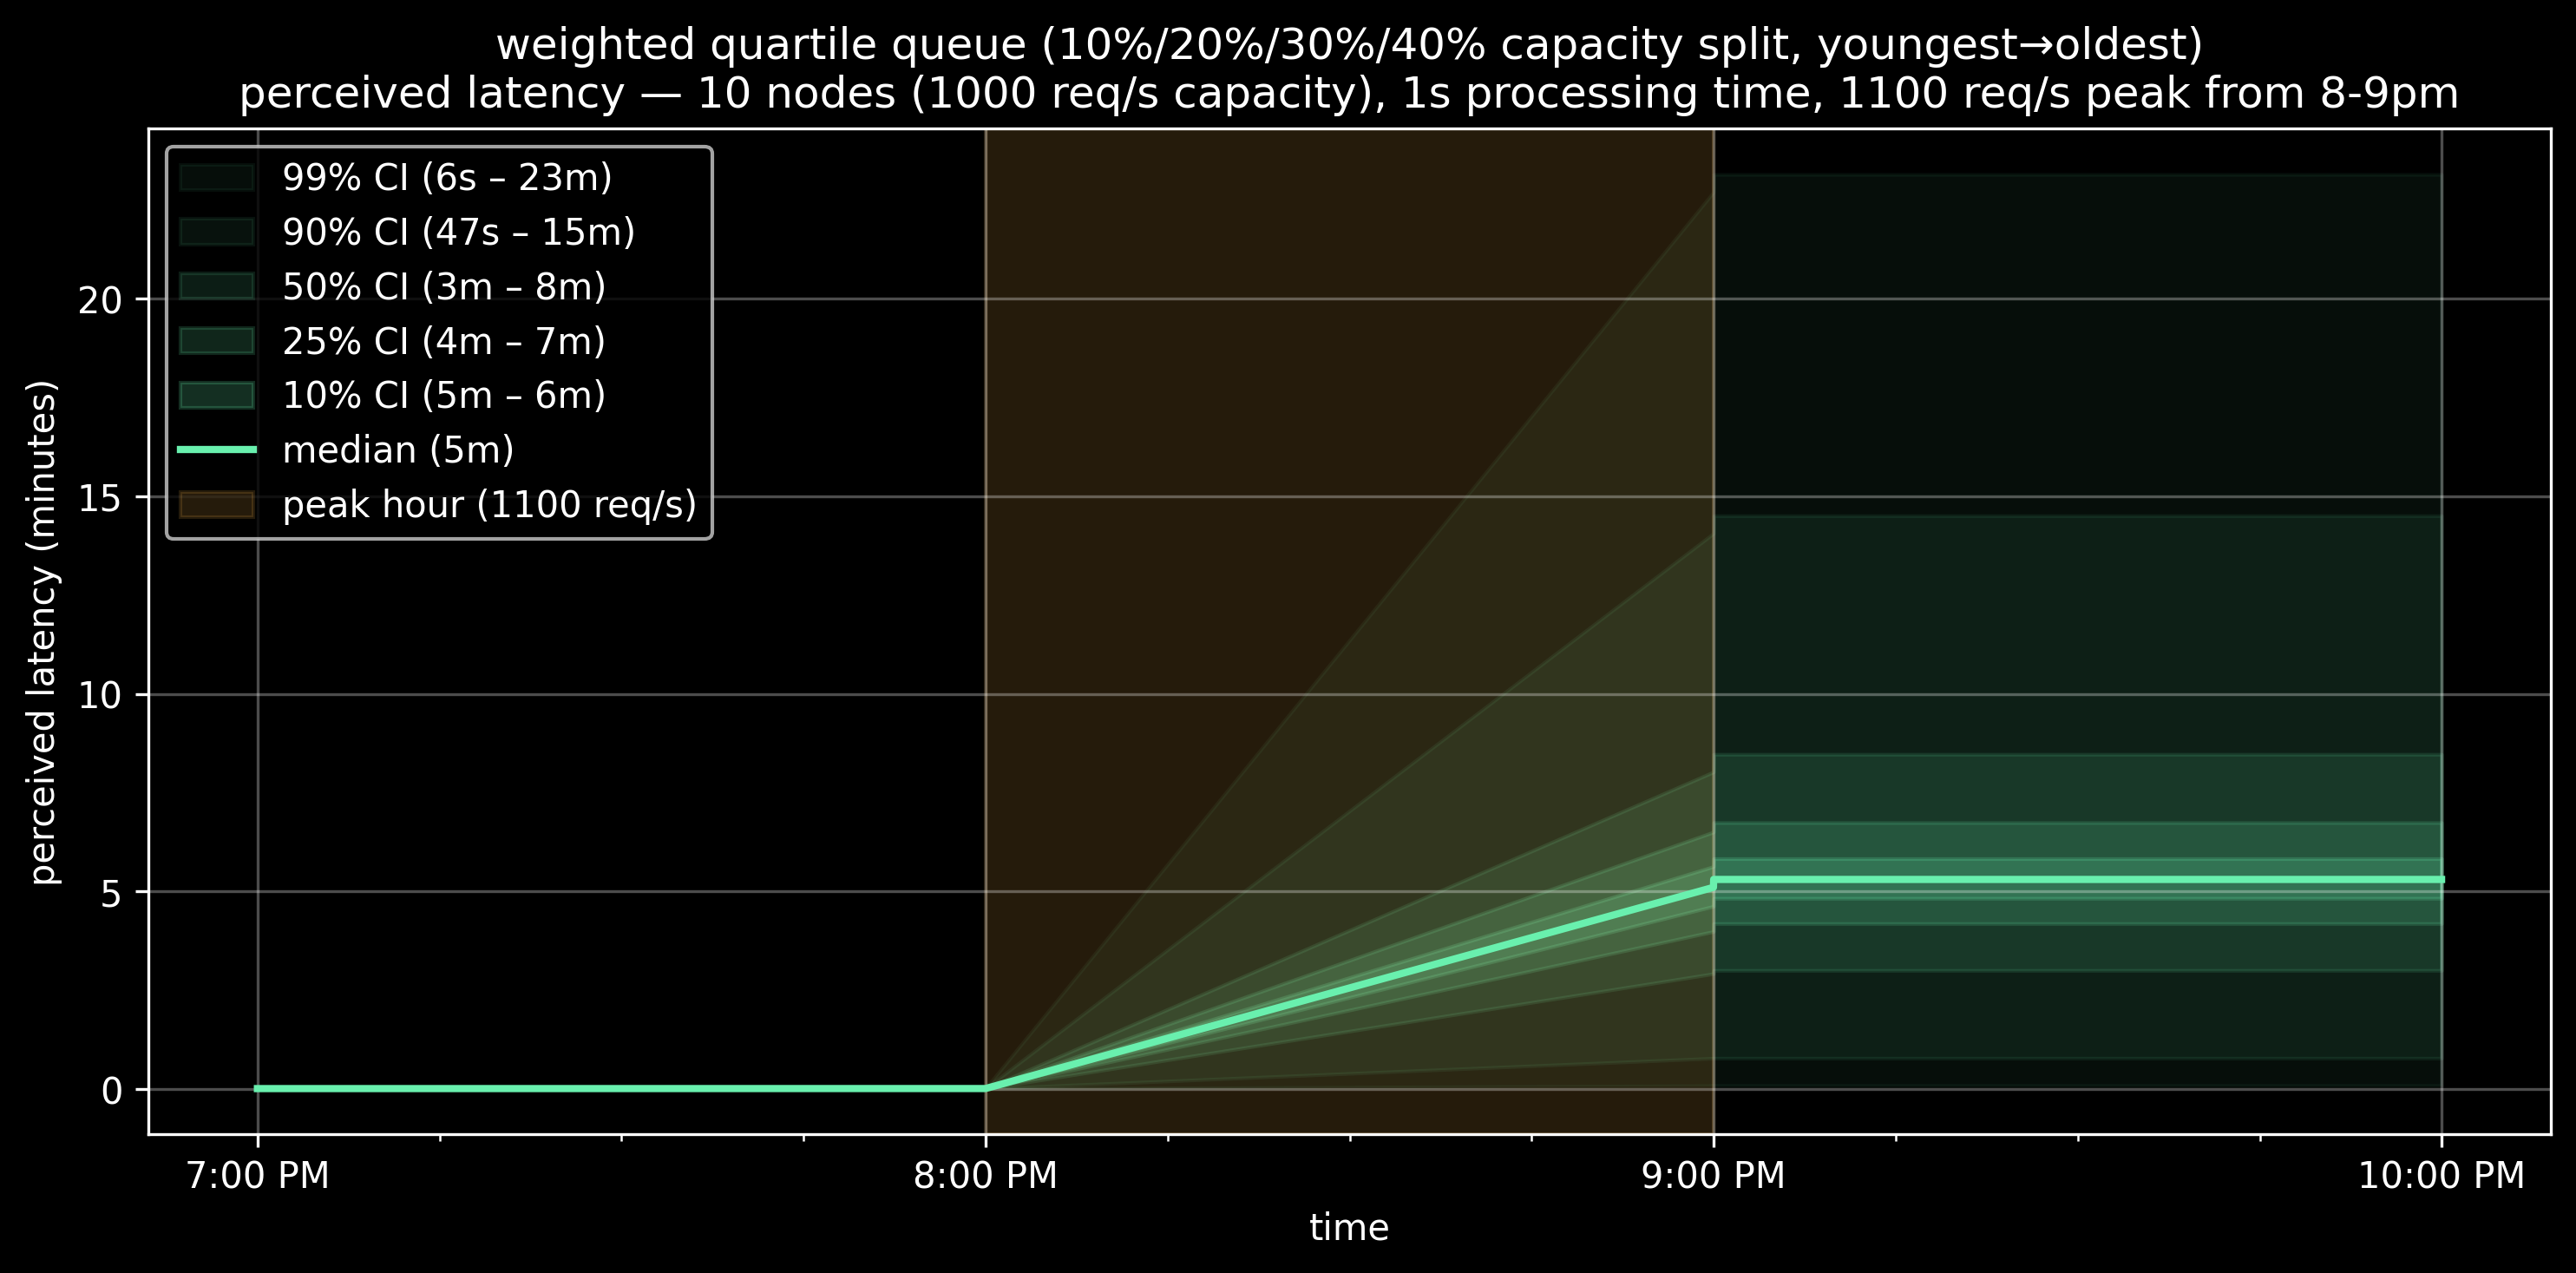
To summarize: It’s a zero-sum game. With a fixed queue and fixed capacity, every “lucky” fast request creates an “unlucky” slow one. You can reshape the distribution, but total suffering remains constant.
Queue Selection Approaches In The Wild
I wondered: if adding a queue was my only viable short-term option, and I wanted to experiment with different selection strategies, how could I proceed? Every product I’m aware of is FIFO or FIFO-ish, with the latter likely being due to eventual consistency. So I did some brief research.
If true random is good enough, it appears you can use Redis’ SPOP.
If you prefer weighted quartile selection, the closest thing I found is Redis’ ZRANGE, using the item’s timestamp as a score. But it’s a heavy lift to compute the quartiles — not something you’d want to do at request time.
You could try to roll it yourself by creating multiple queues with an existing product. But you’d likely have to accept FIFO selection from each quartile. You’d also have to manually move items from newer to older queues over time, which you’d either absorb at request time, or do asynchronously and solve for potential concurrency issues.
Then I briefly pondered moving in the other direction: instead of intelligently pulling from a queue, we proactively schedule processing in the future based on current load, request rate, and our desired fairness algorithm. Another way to describe this would be a job scheduler, and it’s tricky, as things can significantly change on the ground between the time you schedule the job and the time it executes.
These are interesting problems, but feel like side quests.
I also wonder: If I’m paying to add a queue, couldn’t I also just pay to add more capacity, so I don’t need a queue?

If you’ve ever watched a perfectly healthy-looking system slowly destroy itself while your team debates whether the graphs are lying, you might enjoy:
Push To Prod Or Die Trying: High-Scale Systems, Production Incidents, and Big Tech Chaos
The Road to Recovery
In an earlier graph for the 2000 requests/second spike, we saw that our queue grows to 3.6 million items by 9pm, and never recovers.
Because of this, the latency stays high, forever.
How can we shrink our queue and get our latency back to normal? We have to increase capacity.
Capacity costs money, so we’ll want to choose wisely. Here’s a graph of queue size decreasing over time with a few different cluster sizes:

So, if you run with:
11 nodes (10% increase), the queue drains in 9 hours
15 nodes (50% increase), the queue drains in 1 hour
Let’s look at perceived latency as we drain the queue:

With 15 nodes (50% excess capacity) and FIFO queue selection, your latency is 20 minutes at 9pm, but drops to 10 minutes by 9:30pm and back to the original value of 1 second by 10pm. It’s a rough hour, but every second is better than the last.
There’s not much space for cleverness here. You either pay for capacity or your customers pay in latency.
Conclusion
There are no clean solutions for not having enough capacity to meet your demand. Queues are seductive because they seem to make capacity problems disappear.
The key term here is seem, as the problems are still there, delayed until a date and time when the future you looks back at the current you and asks, desperately: Why have you done this to me?
Real-world queues have one significant advantage over software queues: they’re visible. If I see a super long line in a drive-thru, I know what I’m getting myself into. I either pull in and zone out, or move on.
When Claude gets slow and returns frequent 5xx errors, I switch to Codex for a few hours. Sometimes I forget to switch back until I hit my quota.
What you absolutely do not want is your product or service performing like a mystery box where responses can either take 1 second or somewhere between 6 and 60 minutes.
We avoid this by being thoughtful and thorough. Stop adding queues, start adding capacity. Have a wonderful day.

If your systems are fast sometimes, slow other times, and the root cause isn’t obvious — that’s a solvable problem. I help startups design systems that are optimized for latency, easier to reason about, and less likely to generate 3am incidents. Let’s talk.